
|
Azure Spot 影像分析軟體 |
|
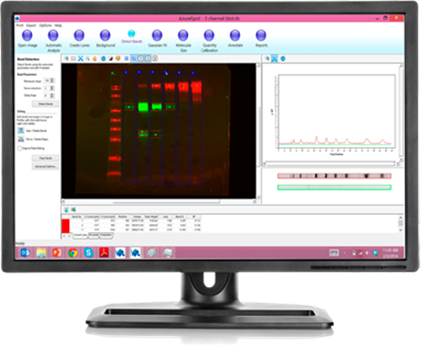
AzureSpot helps you interpret your data easily and accurately. Analyze your gels and blots in either manual or automatic modes. AzureSpot can automatically detect lanes and bands, even on distorted gels, and apply your selected method of background correction. Visualize intensity plots by lane (sample) and channel (probe) to get detailed information about your proteins of interest. The integrated tutorial helps you get the most information out of your analyses. Generate a PDF report of your experiment when you are done. You can also export your data in many formats to other applications (e.g. Excel) for further analysis. |
AzureSpot can● Perform 1D densitometry ● Automatically detect lanes and bands ● Correct for background ● Calculate molecular weights ● Quantify fluorescent signals ● Annotate your results ● Visualize multiplex analyses ● Export reports |
Product Features● Integrated tutorial ● PDF report generator ● Lane creation tools ● Molecular size/pI calibration ● Quantity calibration toolbox ● Module for easy shape selection/deselection ● Wide range of data fields to display in measurements ● Annotation tools for comments and highlighting of image |

|
相關產品 |