

|
Methyl-Seq |
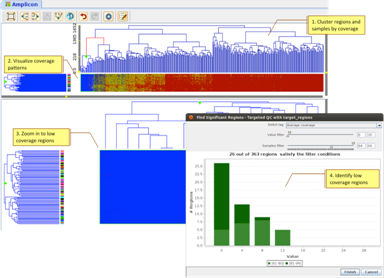
Targeted ResequencingEvaluate efficacy of targeted re-sequencing, and identify regions with low coverage across samples. |
Whole GenomePerform Whole Genome analysis on human or other organisms on your desktop. |
|
Strand NGS supports an extensive workflow for the analysis and visualization of Methyl-Seq data – such as from whole genome or targeted experiments. The workflow includes the ability to detect methylation in individual samples which can be used to further look at differentially methylated cytosines across samples/target regions and also study methylation effects at the genic level. Further downstream analysis such as GO, pathway analysis, etc can be performed on the set of affected genes. |
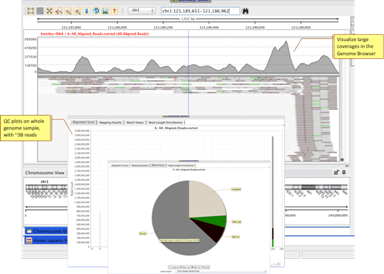
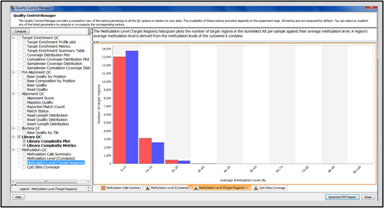
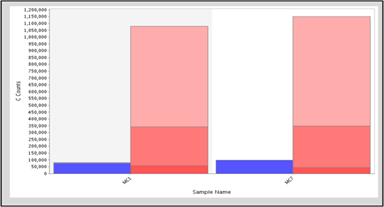
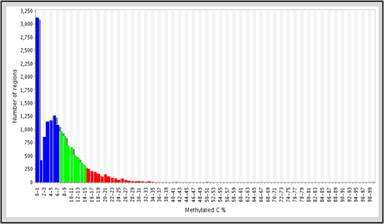
Quality ControlUse the QC manager to look at quality metrics for pre and post alignment, target enrichment and library complexity. Compute methylation specific QC to get information on methylation levels and CpG sites coverage for your samples. |
Methylation DetectionIdentify methylated cytosines for specific loci on the genome for individual samples. Algorithm uses a variety of parameters such as bisulfite conversion error rate, sequencing error, read coverage, base quality and methylation fraction cut-offs for heightened accuracy. |
Differential MethylationIdentify differentially methylated cytosines (DMCs) across experimental conditions. Use this information to further discover differentially methylated regions across these conditions. |
Intra sample analysisIdentify regions with low, moderate, and high methylation density within an individual sample for target regions of interest. |
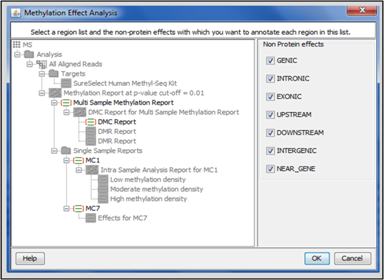
Methylation Effect AnalysisPerform Methylation Effect Analysis to determine the genomic context of the methylated or differentially methylated cytosines resulting from Methylation Detection and DMC analyses. Strand NGS can annotate these cytosines with the selected non-protein effects. |
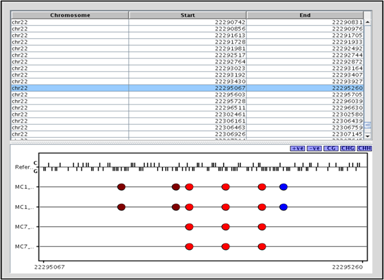
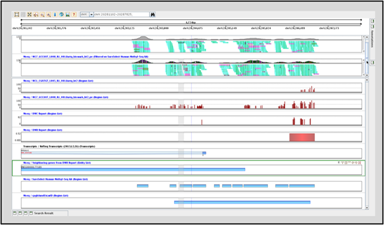
Methylation Specific ViewsUse the Lollipop Plot to visualize methylated or differentially methylated cytosines by regions. The interactive genome browser is customized for displaying bisulfite converted reads. Within the GB, the methylation level histogram helps visualize the proportion of methylated cytosines compared to unmethylated cytosines in the read coverage. |
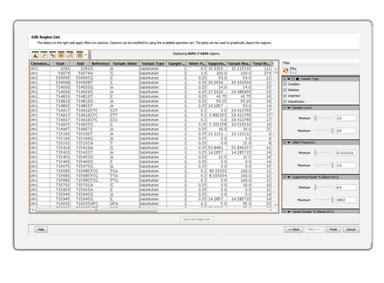
Manipulate Region ListsSeamlessly create and manipulate genomic region lists. Filter region lists based on different attributes. |